
Testing & Diagnosis
Behavioral airflow
-

challenge
• Observed a large discrepancy between the simulated and measured drag coefficients, indicating unexpected aerodynamic behavior
• Needed to understand how air flowed over and around the vehicle under real conditions to identify sources of drag
• Required a practical testing method to pinpoint aerodynamic inefficiencies and areas for design improvement
-

approach
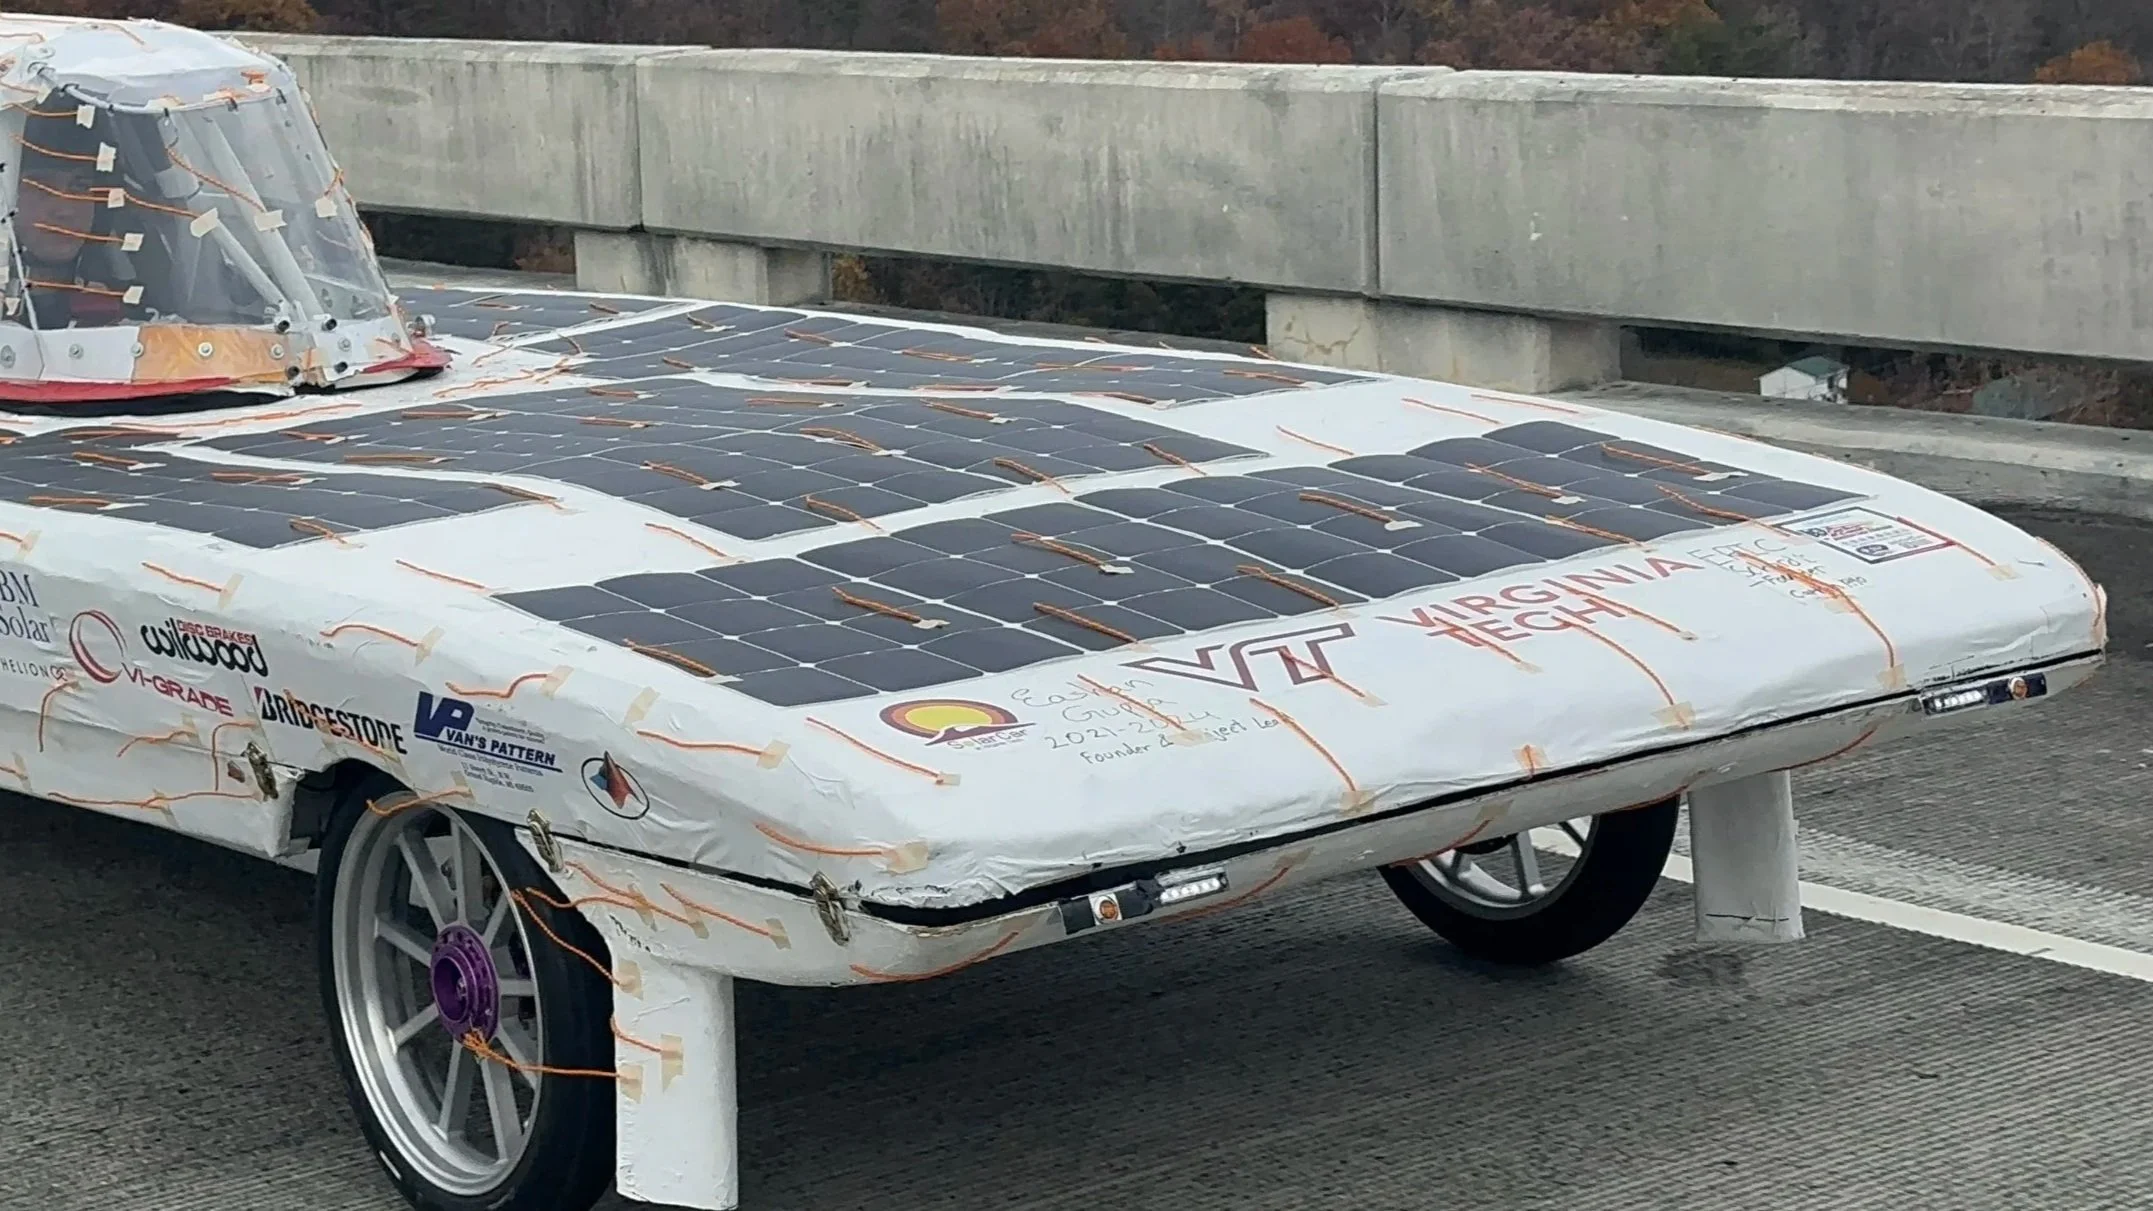
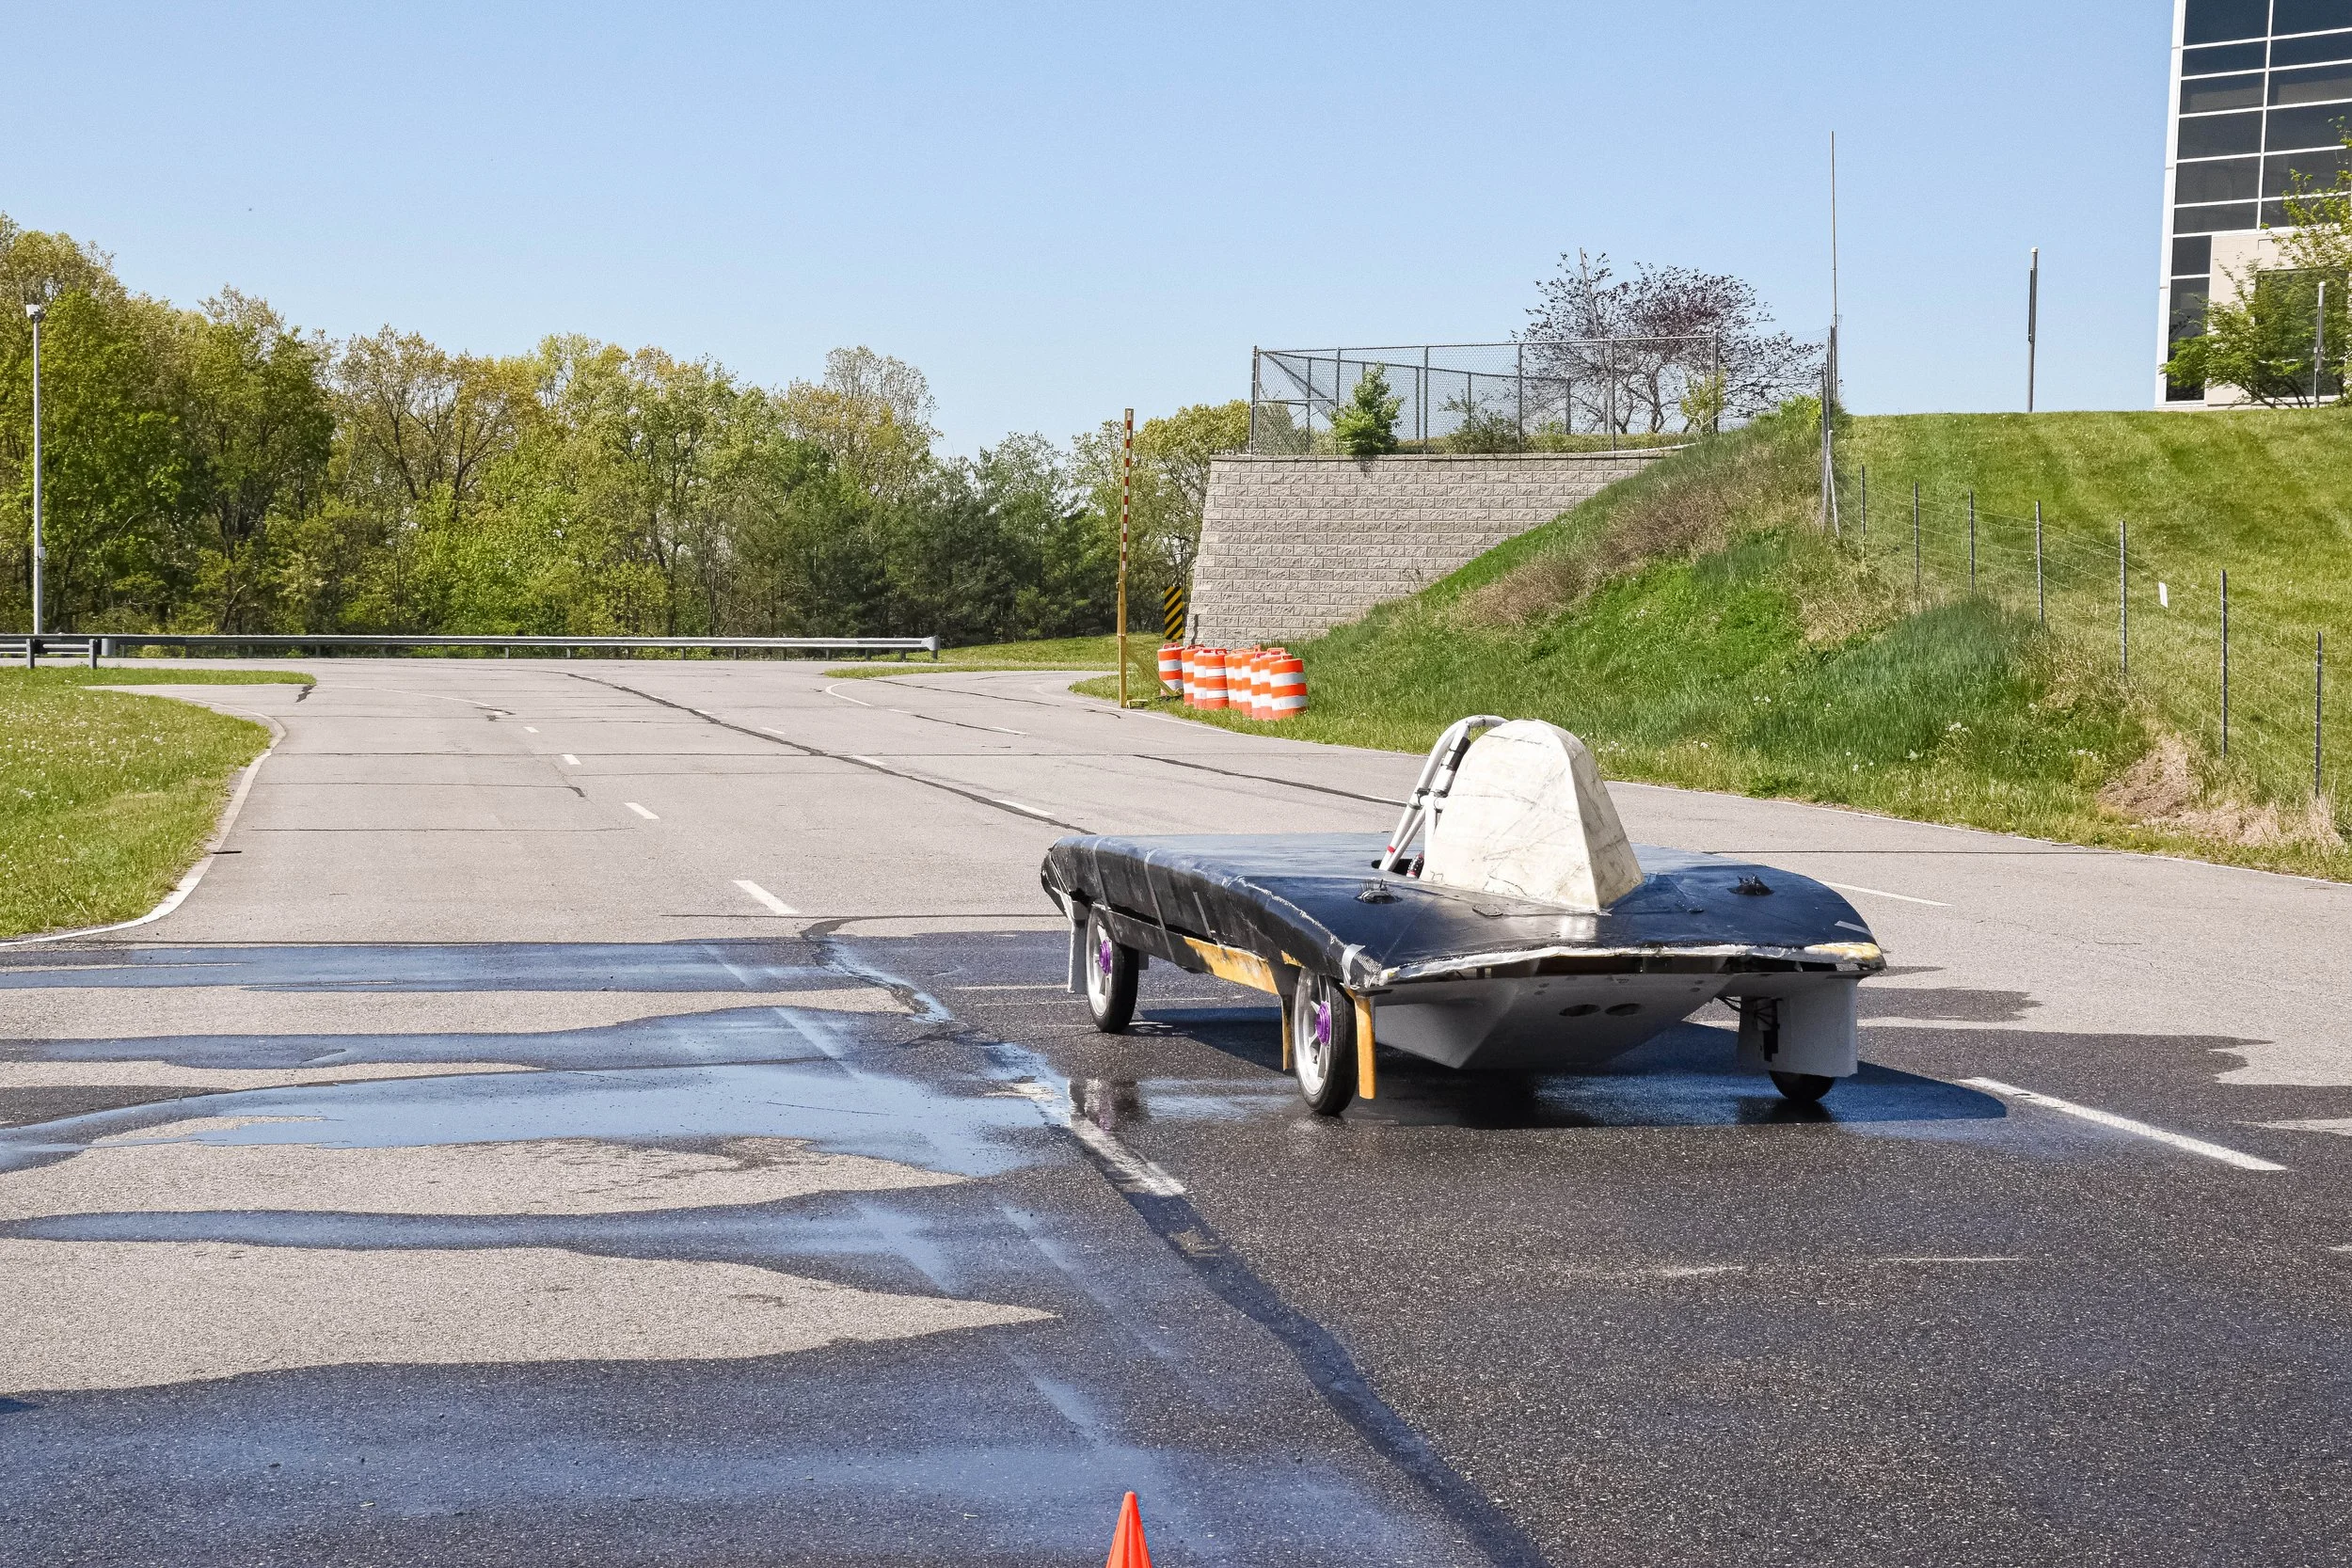
• Instrumented the solar car’s aeroshell with tufts (light strings) to visualize airflow direction and behavior during testing
• Conducted behavioral airflow tests on a closed road highway to capture high-speed photographs and video evidence of airflow movement
• Analyzed tuft motion to identify regions of separation, turbulence, and reversed flow across the shell
-
solution
• Discovered a “parachute effect” at the leading edge, where tufts were pulled inward, indicating unwanted air ingress
• Identified a continuous gap between the upper and lower shells, contributing to drag and turbulent separation
• Determined that the rough aeroshell surface and localized turbulent zones further degraded aerodynamic performance
• Used test results to pinpoint areas for refinement in sealing, surface finish, and shell geometry to reduce overall drag and improve aerodynamic efficiency
Shaker FRequency Response
-
challenge
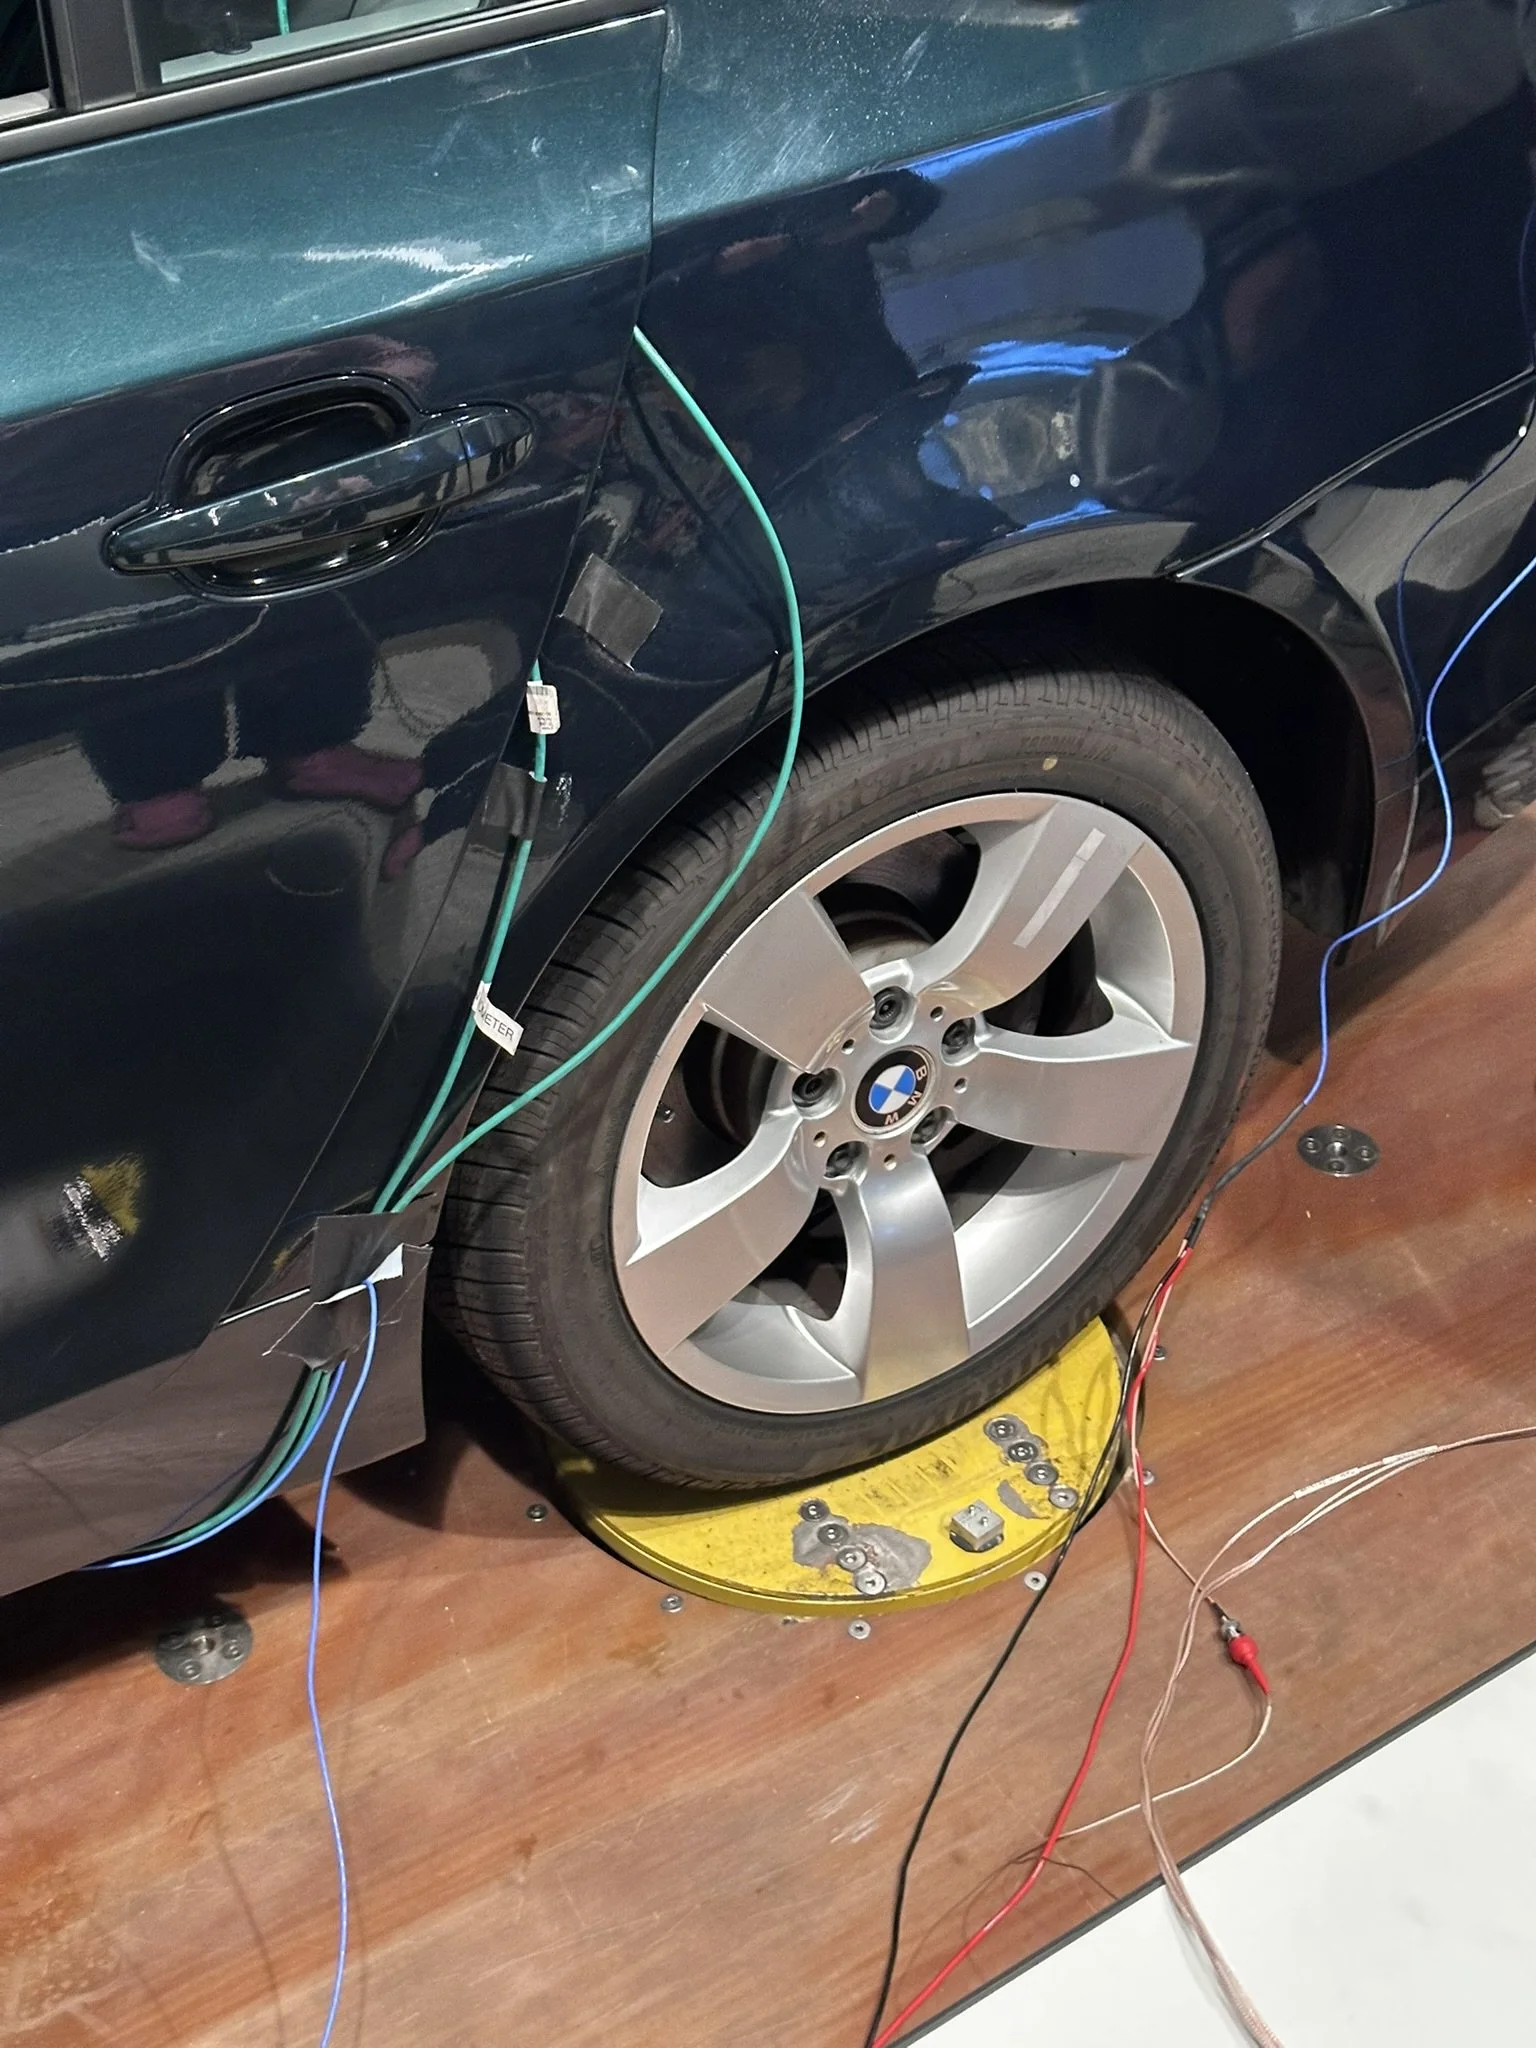
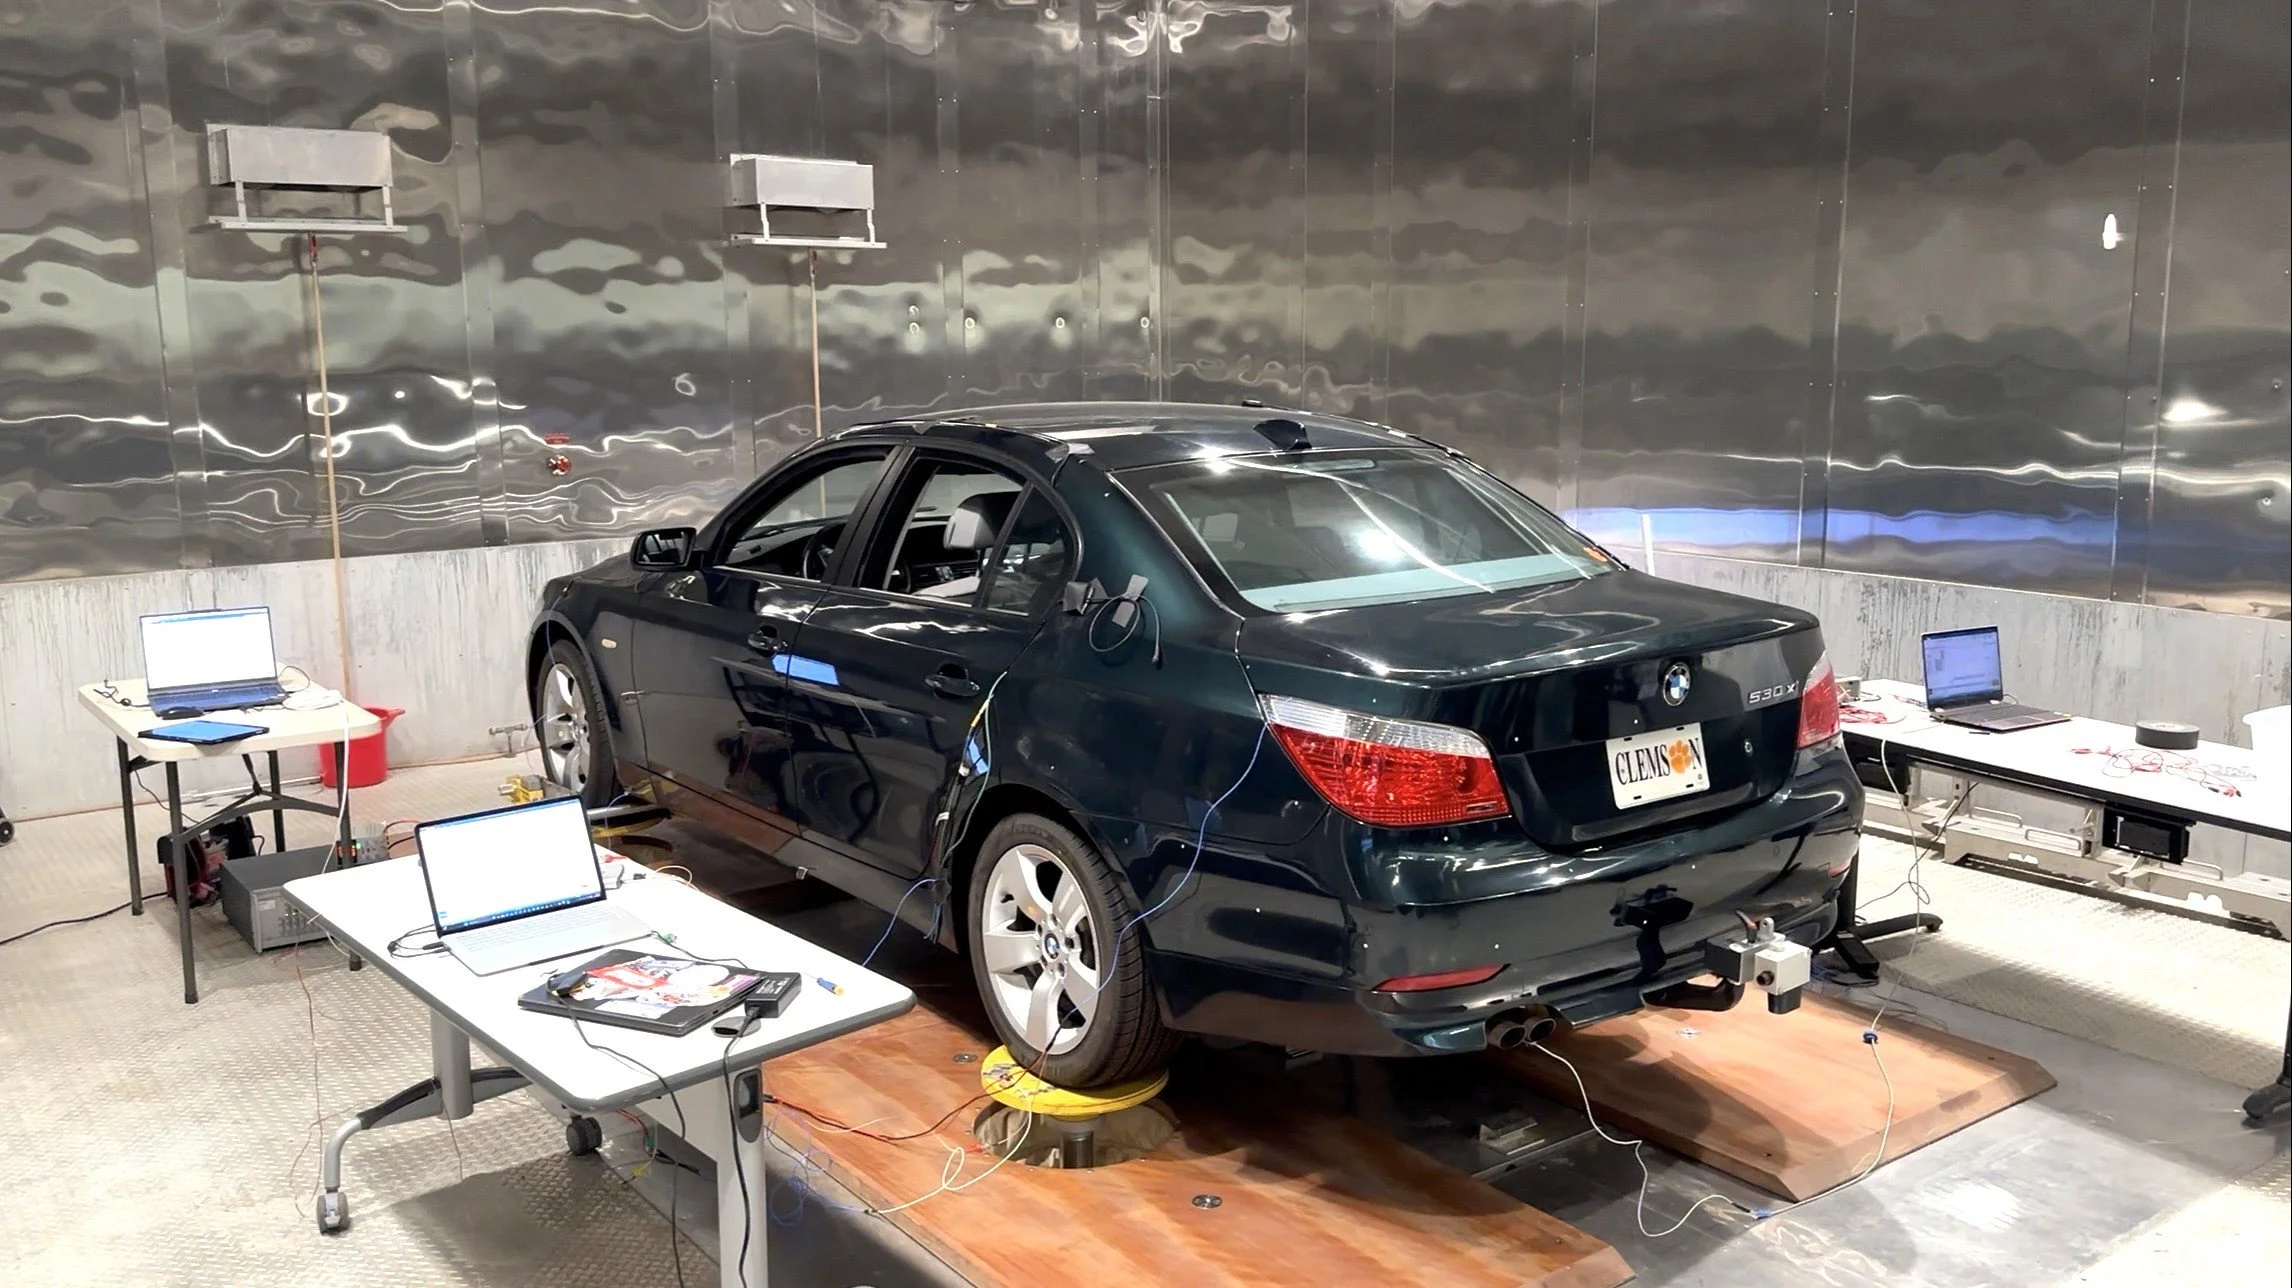
• Understand how this particular vehicle responds to controlled road excitations using a four-post shaker system
• Capture accurate motion data from the sprung mass, unsprung masses, and vehicle CG using accelerometers, gyros, and a calibrated Siemens SCADAS DAQ setup
• Identify key dynamic behaviors: resonant frequencies, wheel hop, and heave/pitch/roll modes to reveal how road disturbances influence the vehicle’s overall dynamics
-
approach
• Instrumented the vehicle and posts with accelerometers in lateral, longitudinal, and vertical axes
• Configured measurement interfaces in Simcenter Testlab to acquire acceleration data from shaker posts, unsprung masses, different sprung mass locations, and the vehicle’s sprung-mass center of gravity (CG)
• Performed 1–25 Hz sine sweeps on the shaker posts in multiple configurations to characterize pitch, heave, and roll frequency responses
-
solution
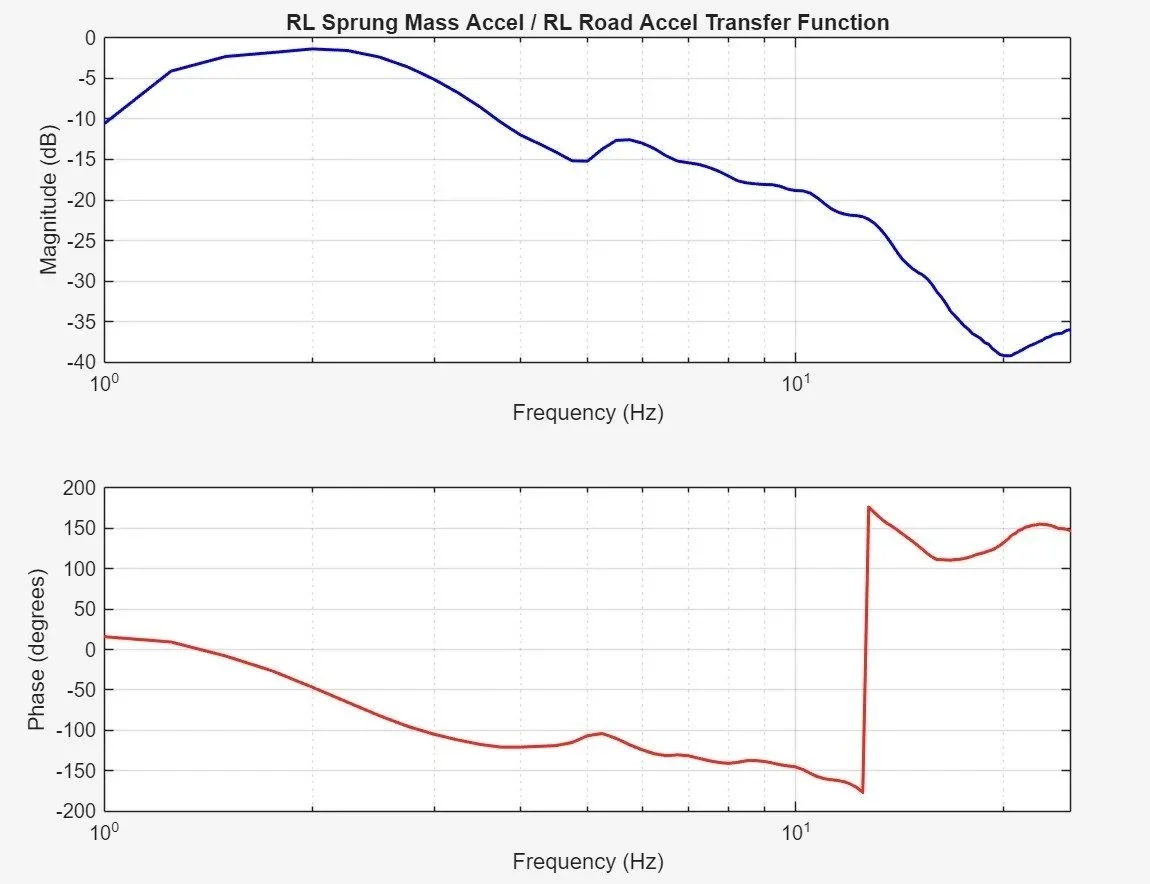
• Analyzed transfer functions and PSD results across multiple tests, consistently identifying key resonant peaks at ~2 Hz, ~5.5 Hz, and ~13 Hz that define the vehicle’s primary dynamic modes
• Verified that CG-level transfer functions exhibited the same resonant trends with reduced magnitudes to demonstrate how the suspension effectively filters vibration
• Compared “cobblestone” road input PSD responses to the controlled sine inputs, revealing slight frequency variations while still aligning with the established resonant behavior
Dynamic testing
-

challenge
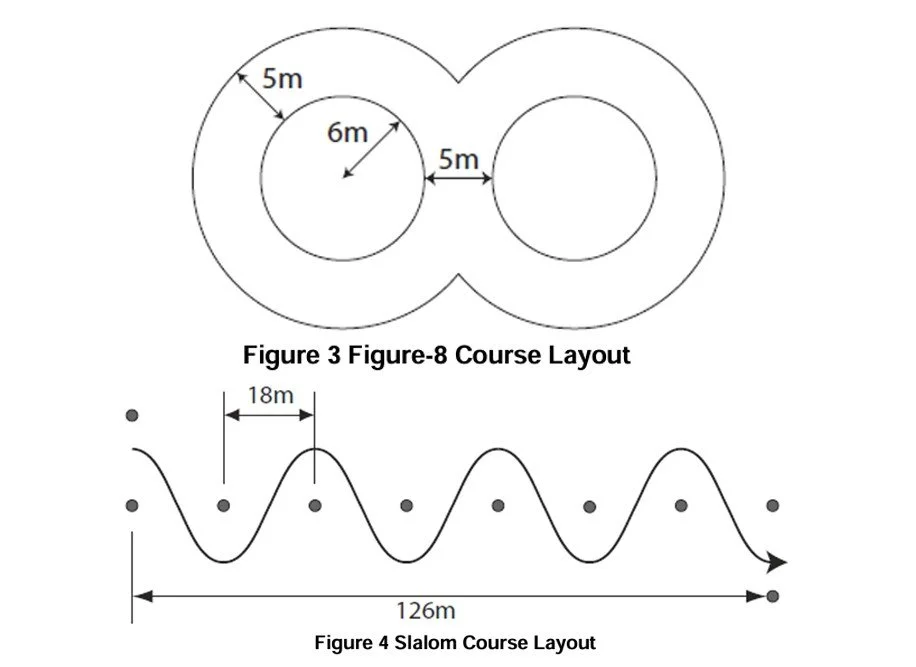
• Demonstrate compliance with American Solar Challenge performance rules for Figure-8, Slalom, and wet-surface braking
• Develop a test plan for a closed-road facility while ensuring driver and bystander safety
• Achieve specified performance targets (≤ 8.0 s/side Figure-8, ≤ 11.5 s Slalom, ≥ 4.72 m/s² wet braking) to pass scrutineering for the Formula Sun Grand Prix competition
-
approach
• Developed a formal closed-road test plan specifying facility layout, safety briefings, observers, and safety mitigations
• Executed course setups per ASC geometry (Figure-8 cones, 18 m slalom spacing) and prepared the braking zone with controlled wetting for repeatable wet-stop runs
• Varied tire pressure to establish to establish performance/efficiency tradeoffs
-
solution
• Collected, documented, and analyzed telemetry and video for all runs
• Figure-8 and Slalom runs consistently met time targets with clear margins (all runs ≤ required times)
• Wet braking tests produced average deceleration above the ASC minimum (average ≥ 4.72 m/s²), confirming stopping performance on a wetted surface
Tracker vehicle optimization
-
challenge
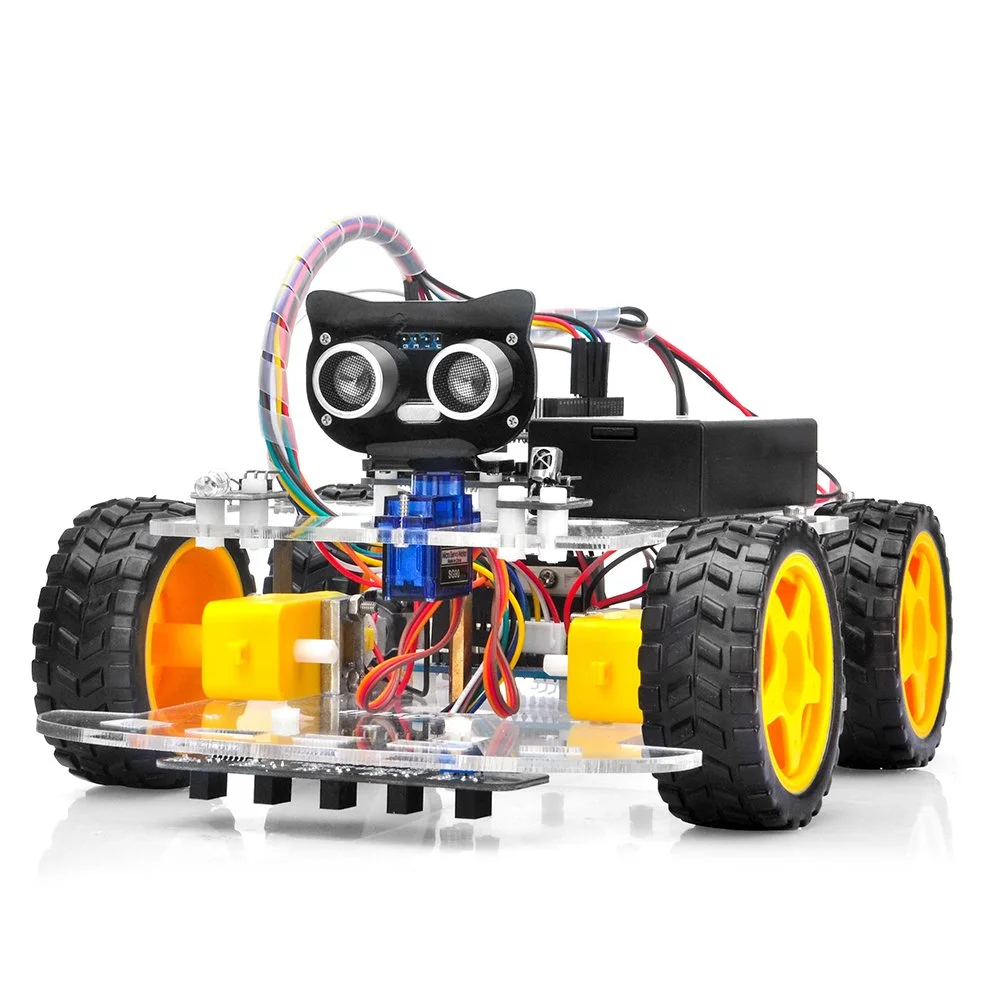
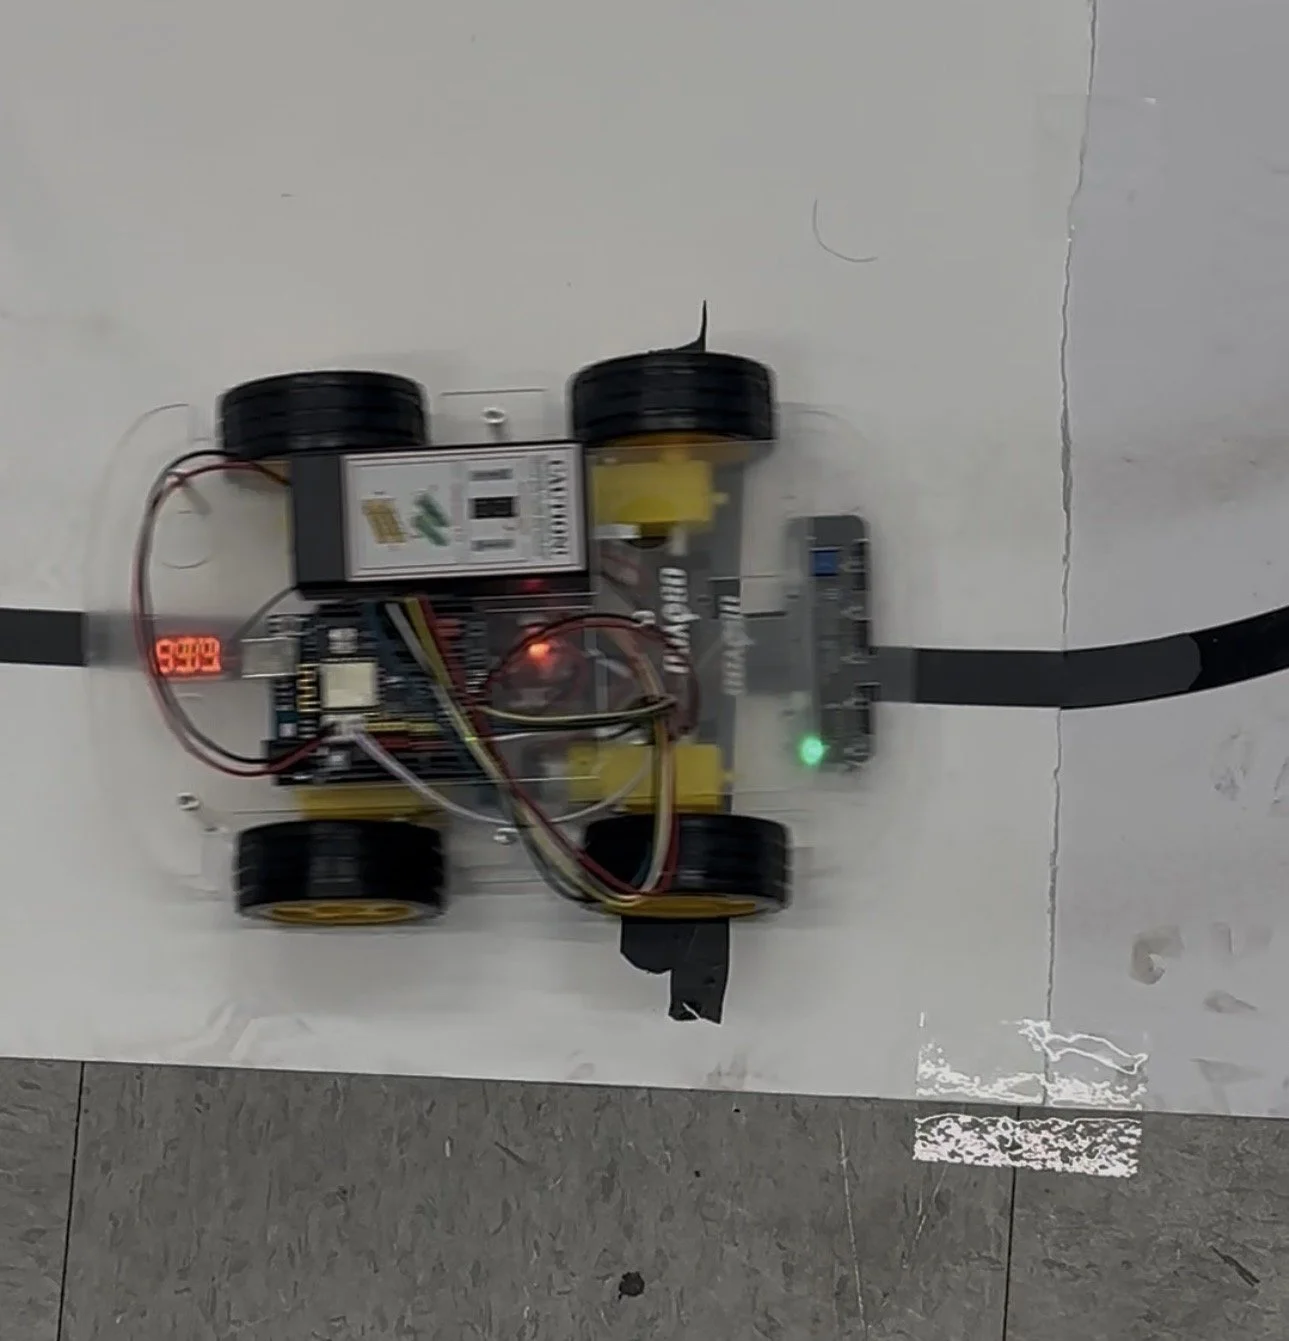
• Use an autonomous line-following car that could not reliably stay on track and change the poor turning logic
• Gain a faster response from the vehicle that could stay on the course and complete the loop faster than the other groups
• Alter sensitivity and control code to achieve consistent, precise, and fast behavior
-

approach
• Redesigned the control logic to optimize wheel speed balance and improve turning dynamics to stay on the line
• Implemented logic for lap counting and automatic stopping after the three laps
• Iteratively tested and tuned system parameters to find an optimal sensitivity and response level.
-
solution
• Developed a higher speed and more stable control algorithm that eliminated erratic reversing and improved turn precision
• Achieved consistent track-following performance and automated lap tracking logic
• Placed in the top 3 for fastest vehicles around the loop